
While building Pingo's new home screen, one of our morph transitions felt wrong on Android. A card animates open into a fullscreen shell with a single spring, and on a budget Android phone (one of those sub-$100 phones that still ships a 120 Hz screen) the card visibly jumped mid-animation, right as the motion was supposed to settle.
The infuriating part: the spring was correct. We screen recorded it, extracted the frames, plotted the card's position over time, and it came out perfectly monotonic. No overshoot, no discontinuity, no rogue keyframe. By every objective measurement the animation was smooth. The person holding the actual device disagreed, every single time.
That gap, "the math is monotonic" versus "I can see it jump", is the whole story. The jump wasn't one bug. It was a stack of independent costs piled onto the same frame, and the biggest by far had nothing to do with our animation code: it was how Skia composites a canvas on Android. Two smaller costs sat on top of it, and because each was visible to a different tool, no single profiler ever told the whole story.
This post walks through those costs in the order they actually mattered, with the profiling that exposed each one and the fix it earned.
If the terms "Fabric", "Shadow Tree", "commit" or "Hermes" are new to you, the React Native render pipeline guide is a great 10-minute primer. We also lean on react-native-skia and Reanimated throughout, building the parts we need as we go.
Why a Correct Animation Can Still Look Like It Jumps
Before any profiling, we had to fix the question itself. "It jumps" is not measurable. "The card's position moves backwards on frame N" is measurable, and it was false. So what were we actually chasing?
On a 120 Hz display you get one new frame every 8.3 ms. The spring produces a correct position for each of those frames, but producing it is work: JavaScript, worklets, Skia recording, a GPU upload. If a handful of frames quietly overshoot 8.3 ms, the display has nothing new to show and holds the previous frame a little longer. The position is still correct. It just arrives late, and unevenly. Three frames at 8 ms, one at 26 ms, three more at 8 ms. Plot the positions and the curve is flawless. Watch it with your eyes and that one long hold reads as a hitch, because human motion perception is far more sensitive to timing irregularity than to a small position error.
"Smooth" is a property of frame cadence, not of the position curve. This is why frame by frame position analysis kept insisting the animation was fine: it was measuring the wrong axis. The whole investigation had to shift from "fix the spring" to "find what steals 17 to 32 ms on specific frames."
There's a corollary for tooling, too: adb screenrecord caps out near 45 fps and isn't vsync aligned, so on 120 Hz hardware it aliases real jank into looking smooth. More than once a recording "proved" the bug fixed while the user, watching the panel directly, still saw it. On a high refresh device, the eye is ground truth.
The takeaway that reframed everything: the spring wasn't the bottleneck, frame delivery was. So the real question is: what does a single frame actually cost? That starts with how a frame reaches the screen at all.
The Dominant Cost: How Skia Composites on Android
Everything visible on an Android display is a buffer, handed to the system compositor, SurfaceFlinger, whose job is to combine every onscreen buffer (your app window, the status bar, a video layer) into the one image the panel scans out. It does that in one of two very different ways, and the choice is the entire story:
- Hardware composition. SurfaceFlinger hands the buffers to the Hardware Composer (HWC), a dedicated display controller block that scans them out directly as overlays. The GPU does no compositing at all. Cheap, power efficient, the path Android prefers.
- GPU (client) composition. When a layer can't be an overlay (too many layers, blending, arbitrary transforms), SurfaceFlinger composites it with the GPU, sampling and blending every contributing buffer itself. That costs GPU time and, on cheap hardware especially, memory bandwidth.
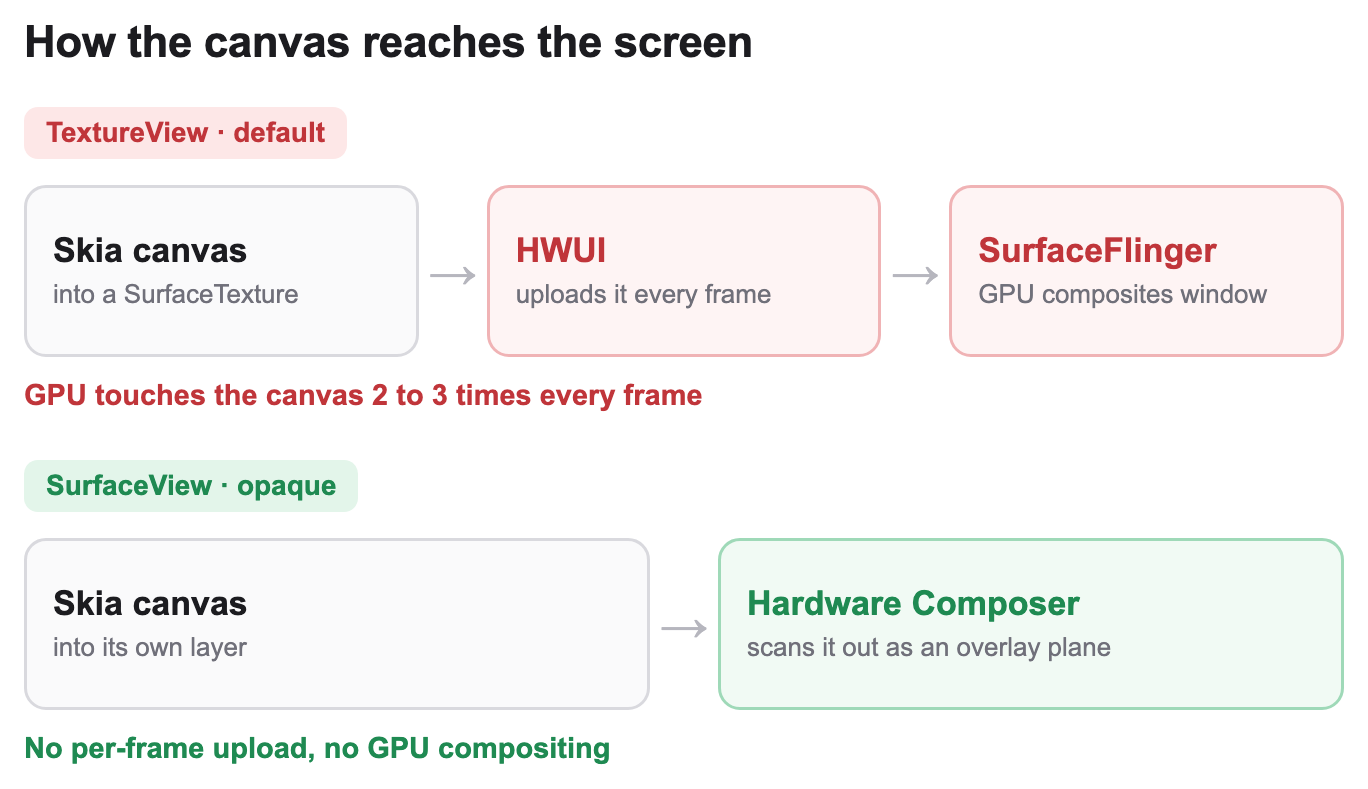
TextureView versus SurfaceView is really just: which path does your canvas take, and how many times must the GPU touch its pixels before they reach the panel? By default react-native-skia backs a <Canvas> with a SkiaTextureView:
We weren't the first to hit this. react-native-skia's own creator filed an issue where a TextureView canvas updated at half the framerate, logging two buffer swaps for every surface update, and noted that switching to a SurfaceView fixed it outright. To see why, you have to know one thing about how Android draws views.
Here's the fact everything hinges on: a normal View is not its own SurfaceFlinger layer. Every button, label and image is rendered by Android's UI renderer (HWUI) into one buffer, the app window, which SurfaceFlinger then composites as a single cheap overlay. A TextureView breaks that. Its content comes from a separate producer, Skia's GPU context, rendering into a SurfaceTexture. For that to appear on screen, HWUI has to bind that texture and draw it into the window buffer as part of compositing the rest of your UI, every frame a new canvas image arrives. That bind and sample is a per frame texture upload.
So on the TextureView path, the GPU touches the canvas pixels two or three times every frame:
- Skia renders the morph into the
SurfaceTexture. - HWUI binds and samples that texture into the app's window buffer (the per frame upload).
- SurfaceFlinger composites the window, now less able to stay a pure overlay because it holds continuously changing content.
That is two to three GPU passes plus a cross process texture handoff, every frame, for a fullscreen surface. None of this is a Skia quirk; it's documented Android behaviour: with a TextureView every visible pixel is effectively composited twice, the content is always composited with the GPU while a SurfaceView's buffer can instead be backed by a hardware overlay that uses less memory bandwidth and power, and the extra buffering adds a few frames of latency on top.
On a 60 Hz flagship you get away with it: 16.6 ms is generous and the GPU is fast. Two things break the same code on a cheap 120 Hz phone. The budget halves to 8.3 ms while the frame count doubles, so the work runs twice as often with half the time each; and "cheap" means a weak GPU and low memory bandwidth, so each pass already takes longer. The upload that hid inside a 60 Hz flagship budget blows straight through 8.3 ms here.
iOS doesn't have this problem. There the canvas is a CAMetalLayer, which composites without the per frame texture copy dance. The same morph was smooth on iOS from day one, which is exactly what made the bug so easy to wave past in review.
Now the measurement. The first tool for any Android jank is dumpsys gfxinfo:
adb shell dumpsys gfxinfo com.pingo.app reset
# ... run the morph ...
adb shell dumpsys gfxinfo com.pingo.app framestats
Two parts matter: the janky frame count and percentiles, and the breakdown of why frames were slow. Ours read 85% janky frames at 120 Hz, and the breakdown was overwhelmingly one bucket, "Slow bitmap uploads: 79%", which is texture upload and sync time, the same class of GPU cost traced above.
But gfxinfo attributes a frame's total time to whichever phase finished last, so a label can overstate itself. We needed an independent signal, and got it from the cheapest experiment in the whole investigation:
The one-line diagnostic that settled it. Force the panel down to 60 Hz and re-run the exact same workload:
adb shell settings put system peak_refresh_rate 60 # restore with 120
Jank collapsed from 85% to 15% with zero code changes. If the per frame work scaled with motion, halving the refresh rate wouldn't help much. Instead it nearly vanished, which means the work per frame is roughly fixed: it fits inside a 60 Hz budget (16.6 ms) and overshoots a 120 Hz budget (8.3 ms). The jank is bound by frame pacing on a fixed per frame GPU cost, not the spring, not layout, not anything you'd find by staring at the animation. The fix has to make each frame cheaper on the GPU.
A Perfetto trace (gfx category, 15 s over several cycles) confirmed the mechanism directly: the RenderThread was the hottest thread in the process during the morph, with onFrameAvailable firing for the TextureView on every vsync. (Perfetto's FrameTimeline is the modern way to mark exactly which frames missed their deadline and attribute why. It does not support SurfaceViews, so here it is a tool for the before state; once the fix below moves the canvas to its own SurfaceView, you fall back to gfxinfo and dumpsys SurfaceFlinger layer dumps.) The fix is a single prop, and we'll get to it. But first, two smaller costs were stacking extra frames on top.
Bisecting at Machine Speed
The dominant cost fell out of gfxinfo in an afternoon. The other two did not. After the SurfaceView swap the JS thread was still hot in patches, and the suspect list was long: the practice engine, a dozen Skia subcomponents, several Zustand subscriptions, the data layer. Any of them could be forcing extra redraws, and bisecting by hand on release builds (rebuild, reinstall, re-run the exact flow, read the numbers, repeat) is slow enough that the repro drifts between runs.
So we automated it. Every candidate got a module scope flag that makes it vanish (if (PERF_DISABLE_X) return null, before any hooks). Then an LLM agent (Claude Code driving our Argent MCP tooling) ran the same loop per candidate, unattended: build a release variant (a dev build measures nothing useful here; we profile release with react-native-release-profiler), replay the exact morph through the UI, capture gfxinfo, and record the row. Several agents ran candidates in parallel, so instead of one hypothesis an hour we came back to a ranked table of "component disabled, 50th pct, uploads %." The two biggest deltas were the next two costs.
The sharpest lesson was the division of labour. The agent is excellent at the loop: building, navigating and measuring a hundred variants without the drift a tired human introduces by run forty. It is useless at the judgment. Early rounds happily "fixed" real but secondary issues (transform allocations, a shadow cache miss) because each showed a small improvement, and it took a human reading the ranked table to see that none of them moved the dominant number. Automate the experiment; keep the hypothesis and the verdict for yourself.
The Second Cost: A Redraw That Should Not Exist
That ranked table put the JS thread next in line, and it behaved strangely. A 15-second Perfetto trace showed mqt_v_js over 50% CPU during the morph with almost no atrace slices. A hot thread doing, apparently, nothing.
That's a property of the stack. To paint a frame, the Skia recorder reads each animated value with a synchronous runOnUISync round trip, where the JS thread blocks until the UI thread answers, and neither runOnUISync nor Hermes emits atrace slices. So the work burning the JS thread is invisible to the system tracer: Perfetto can tell you the thread is hot, never why.
A Hermes sampling profile over CDP sees through it. (Gotcha: drive it from a raw Node WebSocket with Profiler.start / Profiler.stop and a 200 ms heartbeat ping, because the CDP socket closes the moment JS saturates.) The profile named long runOnUISync → savePaint → drawRRect chains inside the Skia recorder, which meant the canvas was being re-recorded far more often than it should be. That is expensive for a specific reason: react-native-skia redraws by walking the canvas's entire scene tree (Container.redraw()) on every React commit, and each animated node in the walk pays its own runOnUISync. A single redraw of our ~150-node canvas measured roughly 13% of the JS frame budget. So something triggering constant redraws is catastrophic.
The biggest source was a surprise inside react-native-skia itself. Its usePathValue and usePathInterpolation hooks build a useDerivedValue whose worklet reads its own output path and calls notifyChange on it, re-dirtying the very mapper that produced it: a self-sustaining per vsync redraw loop. It stays dormant at idle, because Reanimated parks its frame loop when nothing animates. But any global withRepeat(-1) (a logo "breath", a pulsing dot) keeps that loop pumped and revives every one of these self-loops across the app, including on canvases that are offscreen or logically unmounted.
The cleanest way to confirm a Skia component is the cost is to make it disappear: add a module const and if (PERF_DISABLE) return null as the very first line of the component body (before any hooks, which is safe because a module const is stable across renders). With these self-loops live, offscreen canvases pinned the UI thread at 17 to 32 ms/frame with zero interaction. Returning null ran the identical screen at ~9 ms. The cost was unambiguously inside the re-recording, not the spring, not layout, not the GPU.
Unlike the next cost, this one generalises to any app, and we haven't seen the self-loop documented elsewhere: a single infinite animation plus usePathValue anywhere can be silently redrawing canvases right now.
A Smaller, Self-Inflicted Cost: React Churn
The same loop turned up a third cost, smaller and entirely our own doing. A useEffect on the home screen depended on plan, a Zustand store value whose fetch action minted a fresh plan object on every poll even when the contents were identical. That looped the effect, and a downstream useMemo keyed on [plan] produced a fresh completedChapters array each tick. The array was a prop to the memoized canvas, so React.memo saw a new reference, failed, and re-committed the Skia subtree, which from the previous section means another full Container.redraw(). (Margelo's Discord performance write-up goes deep on the Fabric commit side of this kind of settled-animation churn.)
So this was an app specific bug adding extra redraws on top of the two structural costs. It earns a mention mostly for how it hid: it left no UPDATE_PROPS in Perfetto (the cost went through Skia's recorder, not Fabric's mount path) and no atrace slices, so the only thing that caught it was render counter instrumentation plus a React.memo comparator logging which prop broke:
// Replace React.memo(Canvas) during the hunt:
React.memo(Canvas, __DEV__ ? (prev, next) => {
  for (const k of Object.keys(next)) {
    if (!Object.is(prev[k], next[k])) {
      console.log("[memo-fail] " + k); // names the guilty prop
      return false;
    }
  }
  return true;
} : undefined);
One repro cycle, one logcat line ([memo-fail] completedChapters), and the trail led straight back to the store minting fresh objects.
The Fixes, in Order of Impact
In order of how much they moved the needle.
TextureView to SurfaceView
The whole problem was that the canvas lived inside the app window and was GPU composited into it every frame. A SurfaceView fixes that at the root by giving the canvas its own SurfaceFlinger layer:
<Canvas opaque={Platform.OS === "android"}>
opaque flips Skia from SkiaTextureView to SkiaSurfaceView, rendering directly into a dedicated Surface that is its own layer, instead of a SurfaceTexture that HWUI must sample. (The prop isn't in the public Canvas docs yet; the swap lives in SkiaBaseView.setOpaque().) Walk back through the three GPU touches and watch them vanish: HWUI never touches the canvas again, so the per frame upload (the 79% bucket) is gone; the canvas is no longer drawn into the window buffer by the GPU; and because it's now a separate opaque fullscreen layer, the Hardware Composer can scan it out as a dedicated overlay plane, so even final composition costs the GPU nothing. (Devices typically expose only a handful of overlay planes, which is exactly why this pays off for one big opaque layer rather than many small ones.)
That is why RenderThread CPU fell 50 to 65% and slow bitmap uploads dropped to near zero: we deleted a GPU pass and a texture upload from every frame and handed compositing to dedicated display hardware. A dumpsys SurfaceFlinger --layers showing a separate SurfaceView(BLAST) layer confirms the swap took effect rather than silently falling back to a texture.
The tax is the direct flip side of "separate layer": a SurfaceView is opaque and doesn't blend or transform like an ordinary view. So the canvas must own its full backdrop (paint a <Fill> with the page background colour as the bottom Skia layer), and the JSX z-order must be reshuffled so the canvas renders first (lowest z) in its host, because a SurfaceView occludes any sibling rendered behind it; siblings rendered after it composite on top normally. iOS stays on the default CAMetalLayer, which has no equivalent cost.
For a fullscreen, every frame canvas on high refresh Android, this one prop is worth more than every other change here combined.
Killing the Self-Dirtying Redraw Loop
Replace usePathValue / usePathInterpolation with a buffer mutation useDerivedValue<SkPath> that returns a stable reference, and so never notifies on its own:
const pathBuffer = useSharedValue(Skia.Path.Make());
const path = useDerivedValue<SkPath>(() => {
  "worklet";
  const p = pathBuffer.value;
  p.reset();
  // ...same geometry as before, mutating p...
  return p; // same reference every run, so no self-loop
});
This took the idle canvases from 17 to 32 ms back to the ~9 ms floor. One caveat of a stable reference: if a consumer reads this path's .value, it must also read a co-animating shared value, or it won't re-run in lockstep, because the path itself never notifies.
Keeping React Work Off the Canvas
Two patterns, same goal: never trigger a canvas redraw for something that isn't a visual change. First, don't bridge a per frame gate through React. One morph gate (whether a pager could scroll) was driven from a worklet through useState and runOnJS; each threshold crossing fired a React commit that Fabric turned into an UPDATE_PROPS batch, 8 to 15 ms of UI thread block landing in the settle window. Drive it imperatively from the worklet instead:
useAnimatedReaction(
  () => progress.value > 0.05,
  (active, was) => {
    if (active === was) return;
    scheduleOnRN(applyGate, active); // imperative ref call, no React commit
  },
);
Second, the refetch loop: drop the freshly minted value from the effect's dependency array (re-fetch only on genuine user intent), and key the downstream memo on content, not object identity, so a future regression can't cascade through React.memo again:
// instead of useMemo(() => ..., [plan])
const key = plan.completed_chapters.map(c => c.id).join("|");
const completedChapters = useMemo(() => ..., [key]);
Removing Per Frame Allocations
Many useDerivedValues each returning a fresh transform array allocate thousands of objects per spring; the resulting Hermes GC pauses are invisible during fast motion and very visible during the subpixel settle. Same buffer mutation idea: allocate a stable buffer once, mutate its numbers in the worklet, return the same reference. A companion win is quantising any per frame shadow or blur alpha to a small step count, since Skia's blur mask cache is keyed on (blurRadius, color) and a unique float per frame misses the cache every time.
Real World Results
On the same sub-$100 handset, same repro, the morph went from 85% janky frames to comfortably within budget. There is no symmetric "after" percentage to quote here: once the canvas moves to its own SurfaceView it composites off HWUI, so gfxinfo can no longer attribute its frames at all. The win shows up instead in the RenderThread CPU drop below and in the Perfetto trace further down. What each fix contributed, in order of impact:
| Change | Impact |
|---|---|
opaque SurfaceView swap | RenderThread CPU down 50 to 65%, slow bitmap uploads near zero. The overwhelming majority of the win. |
Buffer mutation SkPath | Idle canvas frame time from 17 to 32 ms down to ~9 ms, removing the self-sustaining per vsync redraw. |
| React state and refetch cleanup | Removes avoidable React commits that re-record the canvas during the morph. |
| Removing per frame allocations | No Hermes GC pauses during the settle. |
Everything below the SurfaceView swap was cleanup on top of it.
See it on a real device
Both clips below are the same progress → history → chapter-detail morph on a sub-$100, 120 Hz Android phone, captured with adb screenrecord. Left (red) is the regressed build; right (green) is the shipped build.
adb screenrecord caps near 45 fps and aliases 120 Hz jank toward smooth (the corollary from the start of this post), so here is the same comparison slowed 2×, where the before side's stalls and the chain card jump at the settle are easy to see:
The Perfetto trace shows the compositing story directly. Each thread has two rows: the thin top bar is its scheduling state (green is running on a CPU core, gaps are idle) and the band beneath is the call stack it is executing.
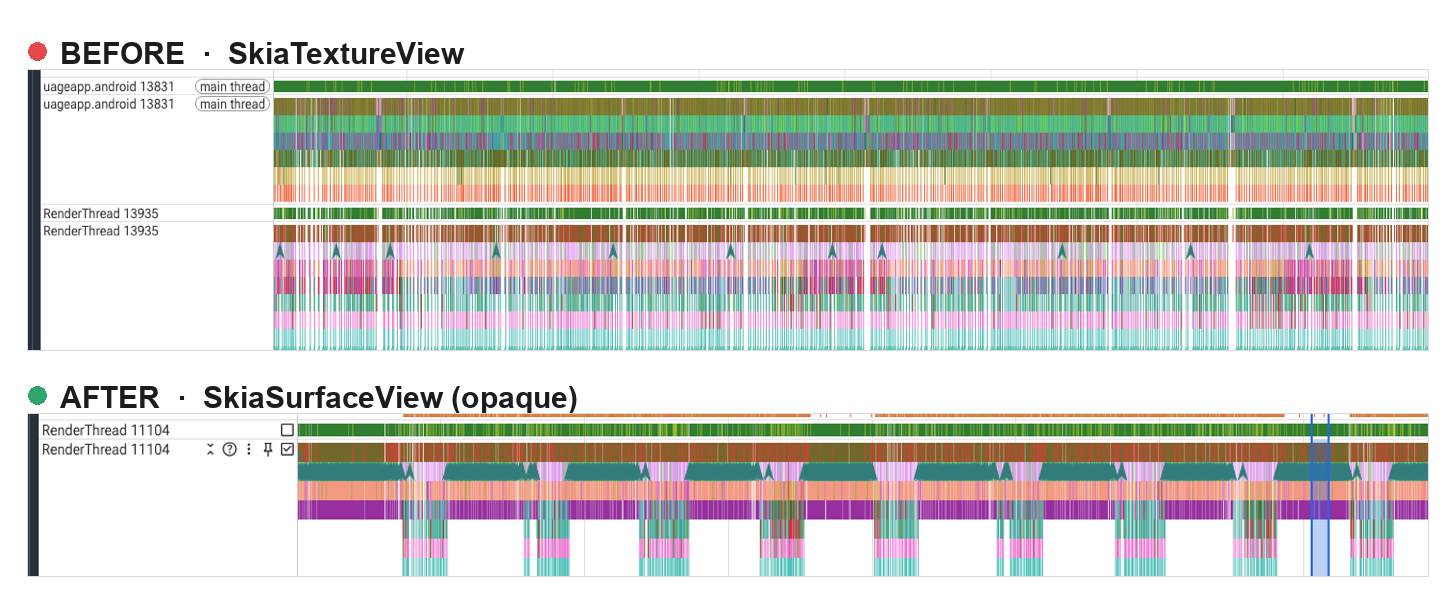
On the TextureView path (before) both threads are saturated: solid bands edge to edge, no idle anywhere. The RenderThread is still uploading the canvas when the next vsync arrives, so the frame lands late, and the main thread is pinned right alongside it from the redraw churn. On the SurfaceView path (after) the RenderThread collapses into a rhythmic comb, one short burst per frame with the thread asleep in the gaps. The canvas now composites in a hardware overlay instead of a per frame texture upload, so the upload work that used to fill the gaps is gone and the RenderThread's remaining per frame compositing fits inside those short bursts, while the main thread goes quiet enough that it is no longer worth showing.
The most important result isn't a percentage, though. It's that the user stopped seeing the jump, the thing no position plot could ever confirm.
Final Words
The biggest performance wins on budget Android are structural and live in the rendering pipeline itself, not in your animation code. How Skia composites its canvas, TextureView versus SurfaceView, dwarfed everything else we found. The redraw and React churn issues were real and worth fixing, but they were cleanup on top of that one structural change.
What made the ordering hard to see is that each cost answered to a different tool: gfxinfo for frame pacing, a Hermes sampling profile for the JS thread the system tracer can't see, and plain render counter instrumentation for React churn. Reach for all three before deciding what matters, and on high refresh Android, check the compositing path first. When the suspect list gets long, automating the build-navigate-measure loop is what made bisecting tractable, as long as the hypotheses and the verdicts stay human.
What's Next
Most of these fixes generalise to any high refresh Android Skia surface: the SurfaceView swap above all, then the buffer mutation path and transform patterns, then the discipline of keeping React commits off the canvas during animation. In a follow-up we'll look at pushing card content into the Skia scene itself, so the entire morph is GPU composited under one transform instead of paying the view tree compositing cost on every frame.